Dec 20, 2025
Dec 20, 2025
The traditional system of observing transit or Gochara movement of Planets are replaced by and unique system of graphical representation through which any astrological observer can view the entire planetary changes in his/her Desktop computer at a glance. The accuracy of longitude of planets is ± 5´ arc.
People, who used to observe astrological time through yearly ephemeris, will get much help with my system of monthly longitudinal graphs of planets based on Nirayana planetary data offered by the Positional Astronomy Center.
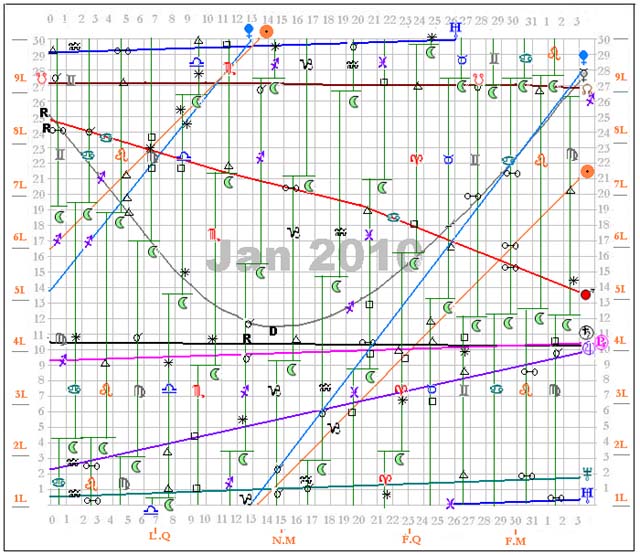
It had been actually developed by me in 1994 to observe the relation of planetary changes with daily business events by eyewitness. In 2008, I was able to make such longitudinal graphs in an ordinary personal computer with color monitor, which gives a great convenience to view the slightest planetary movement and Moon’s daily Transit path. Thus the below longitudinal graphs for January 2010 is given with a few dates extended for February 2010.
The graph below has been made from the data of Lahiris Ephemeris 2010 edition. The vertical column represents each day of the month. The horizontal line indicates planetary longitude at 5-30 hour IST or zero hours GMT in a particular date. Thus on 0 line the longitudes of all the planets on 1st January marked and on the 1st column the longitudes of 2nd January were marked. In this way the Tulyansa or equivalent longitude of the all the planets thus created individual planets transit graph line. Since Rahu-Ketu (true) is always lies in same longitude, the line of their transit is always in same line.

In the left and right side of the graph the Orange color divisions from 1L, 2L,…. 9L are the nine Navamsa divisions of every Zodiac signs. Different planetary graphs are represents by different color lines Sun orange, Mon light green, Mars red, Mercury ash, Venus blue, Jupiter violet, Saturn black, Rahu-Ketu brown Uranus royal blue, Neptune deep green, Pluto pink etc.,
Each planet’s path of equivalent longitude, in respected zodiac sign is shown at the starting point of the path by the zodiac sign where they transit now. All planetary signs and zodiac signs are internationally approved signs used in Astrology also in Astronomy. I do believe some day in future Western astrologers also for its great convenience will be adopt this graph of transit planets as they can be easily fix in a single display page of any PC.
Except Moon’s transit (which is shown by the vertical green line started at any particular date with moon’s symbol) as her deviation of longitude in a day is much higher than all other planets. On each day moon’s transit line the zodiac sign of that particular sign is marked to identify about its rasi status. All the planets relation with moons transits like conjunction, trine, square, sextile, opposition etc are marked t the crossing point of moon such that learned astrologer can assume the daily events far in advance.
The date of retrogression and direct motions of planets are marked with capital R and D respectively. At just below of the graphs the quarters of moon, full moon and new moon dates are written.
Thus the graph is reality represent every aspects relations of planets themselves and with moon and all the navamsa of all the zodiac. If anyone add the exact ayanamsa of the year to the planets, this graph will be useful to western astrologers also.
This graph with navamsa of transit planets and dasa of moon and daily timing of rising ascendant of any particular place is capable to observe the earthly events with heavenly events what any true astrologer need every day.
In future, this graph can be rich with further data hyperlinked with certain important points of the graph. But since I am not a software expert, I am unable to do so.
My objective to create this Tulyansa or equivalent longitude graph is to verify the astrological truths of different systems including my invented methods of last 30 years.
My approach is very rational as my forecast systems are proven reality event to predict every 10-to15 minute events, which I developed and observed first in 1994.
The Advantage of this system: