Dec 31, 2025
Dec 31, 2025
Collins English Dictionary (CED) is one of the best online dictionaries and my most favourite one. For any given word I have found that CED contains much more relevant information as compared to other online dictionaries. One of the word-related data which one can find in this is the statistics of its recorded usage for three hundred years starting from 1708 up to 2008. The statistics is presented in graphical form. Just a glance would give quite a bit of information about the word, its relevance at different times etc. A typical graph is shown in the figure below for the word “nuclear”.

As we know that as a field of study nuclear physics is just about one hundred years old. Most of the theoretical knowledge was acquired between about 1920 and 1940 and the nuclear bomb was deployed at the end of World War II. But applications of the theoretical knowledge for weapons and for peaceful purposes was post 1950 (dotted vertical line). This information is very well reflected in this graph. The peak usage happens to be around 1980. That is the time perhaps when the technology got saturated,

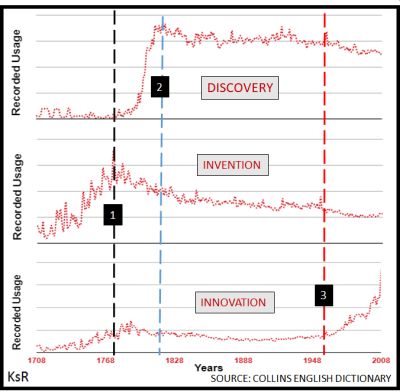
Out of curiosity I looked into the graphs of three related words DISCOVERY, INVENTION and INNOVATION. I have clubbed the graphs in a single figure as shown above. As is generally understood, “discovery” leads to new knowledge. Inventions result in a new things. Successful innovations give rise to new applications of known things. In the figure there are three vertical lines marked 1, 2 1nd 3. They have all their own significance which we will look into.
Line 1 corresponds to peak usage of “invention”. That corresponds to time between 1770 and 1780. The period coincides with industrial revolution. The success of industrial revolution gave impetus to inventions. The word has remained dominant, though not at peak, for more than one hundred and fifty years.
Line 2, at about 1800, witnesses a sudden spike in the recorded usage of “discovery”. The time, one can say, heralds the birth of modern science. That was the time when scientists started getting insights into nature and thereby new knowledge got generated. The most significant aspect of the DISCOVERY graph is that it has remained dominant for more than two hundred years. The message is that knowledge is limitless and humanity continues to acquire new information. New elements get discovered, newer phenomena get unravelled, and more insights into the whole universe are getting generated.
Line 3 corresponds to our times at 1950. The year is significant as “innovation” started overtaking “invention”. Till that time the word was dormant. Around 1940 Joseph Schumpeter, the Austrian Political Economist, defined innovation as any invention implemented to serve a useful purpose. That had profound impact on corporate bodies and the leaders started focusing on innovation. For the last seventy years innovation has become the buzzword. It has even become an accepted yardstick for measuring the progressive attitude of organizations and nations. For example, we have “Global Innovation Index” which ranks various countries for their innovative initiatives and contributions. There is a popular slogan which says “innovate and flourish, else you will perish”. The word peaked as of 2008 and the trend is upward.
These three words apart, the message I wish to give here is that the graphs to be found in CED have stories to tell when correlated with history. The intent to learn such stories will be an interesting intellectual hobby and food for thought.