
Mar 21, 2026
Mar 21, 2026
The phrase “Democracy Index (DI)” was coined by Economist Intelligence Unit (EIU), a UK based private organization. The salient features of the term were presented and discussed in an earlier BOLOJI article. In this article, we will take a closer look into the DI-related statistics exclusively concerning India. It is assumed that the data and information put forth by EIU is unbiased and truthfully reflects the answers provided by the respondents to the questionnaires.
Our democracy is a little over seventy years old. The best thing about it is the fact that it has withstood the test of time and is vibrant. Looking back, the greatest moments in our democratic history can be identified as the years 1977 and 1979. In 1977 during emergency, Indian people threw out the powerful Indira Gandhi and her Congress party for Emergency excesses. Just two years later the same people threw out the Janata government for its non-performance and in-fighting and gave power back to Indira Gandhi. The year 1977 should have ushered in a desirable two-party system in India. But unfortunately that was not to be and the current Indian political scene is characterized by multi-party system, regional parties and political, often opportunistic, alliances. There was a time when it was felt that there is no alternative to Congress party. Today it is appearing that there is no alternative to BJP. In spite of all these, it can be said that democracy in India is very much alive and kicking. This article will deal with EIU data covering the last fifteen years with focus on analysis and course corrections which may appear to be necessary.
RANKING: Currently India is ranked 51st among 165 countries covered by the study as shown in the figure below.
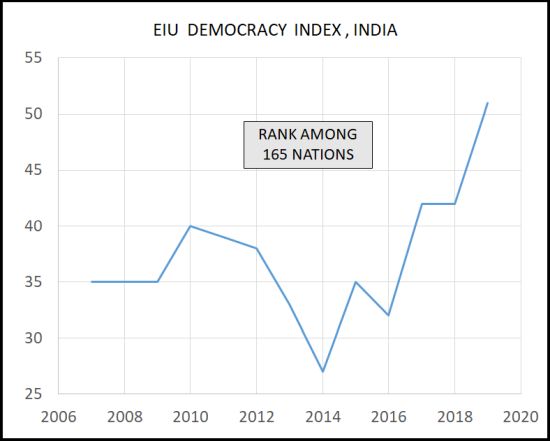
The average rank is about 37 and the best is 27. The major worrying factor is that there is big dip of nineteen slots between2016 and 2019.
OVERALL SCORE: Data concerning the overall score of DI is shown in the figure below.
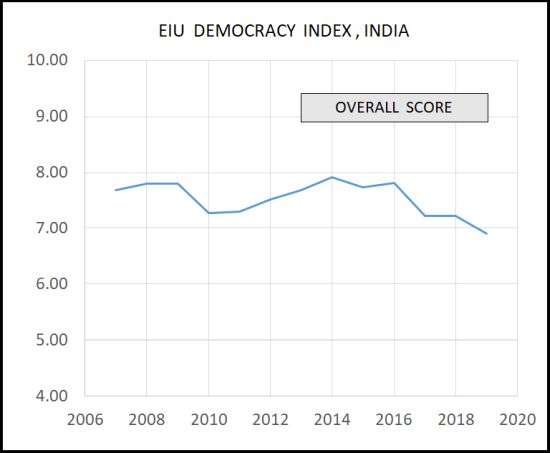
The current score of 6.9 happens to be lowest over the time period considered. In 2014, the score was 7.92. That was the closest that India came to be categorized as "Full Democracy".
ELECTORAL PROCESS AND PLURALISM: Score on this item is steady at 9.58 till 2016. But it has dipped to about 8.7 during the last three years.
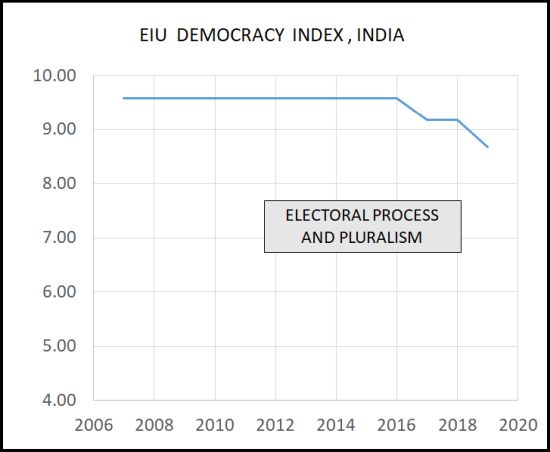
This aspect needs to be looked into and analysed further.
GOVERNMENT FUNCTIONING: The graph is shown below.
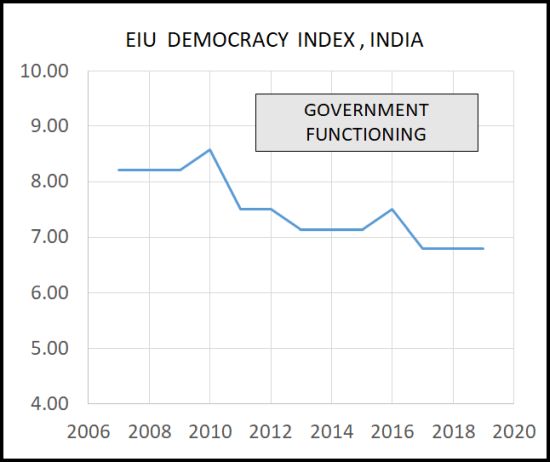
There is almost a steady dip from about 8.2 to about 6.8 over the time span.
POLITICAL PARTICIPATION: Overall, political participation is not healthy being always below or just a little above.
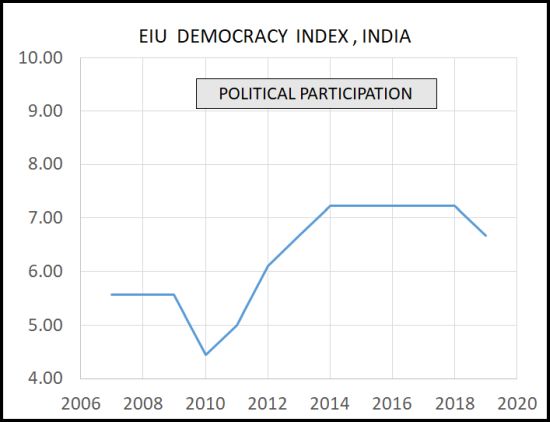
Low literacy level is possibly one of the reasons.
POLITICAL CULTURE: Political culture is closely related to political awareness.

Here again, we see that the scores are far from healthy.
CIVIL LIBERTIES: This is one of the major barometers of health of any democracy.
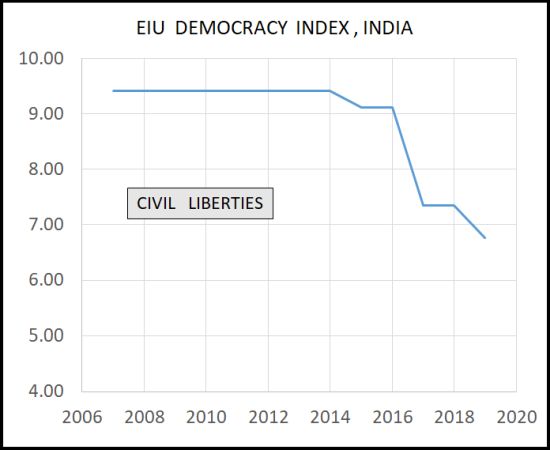
The associated data as in the figure above is somewhat disconcerting. The index which was steady at about 9.4 over time suddenly is dipping to lower values post 2014. The current value at 6.8 is very disturbing. This is a matter for deep introspection.
CLOSURE: Overall, the picture is far from healthy as far as democracy in India is concerned. What is even more serious is the downward trends. In my considered opinion, authorities and political parties concerned should look into the data dispassionately and find ways of making India a healthier democracy.