Jun 18, 2026
Jun 18, 2026
As we all know, India is the fifth largest economy in the world today. India is slated to become the third-largest by the turn of the decade. This data is based on the Gross Domestic Product (GDP). India, however, is the most populous country in the world. Therefore the true status of our economy is reflected if we know the values of “Per Capita GDP (PCGDP)” which is the quotient defined by GDP/Population. The present article is written with a focus on Per Capita GDP. The map below is taken from Wikipedia.(https://en.wikipedia.org/wiki/List_of_countries_by_GDP_(nominal)_per_capita)
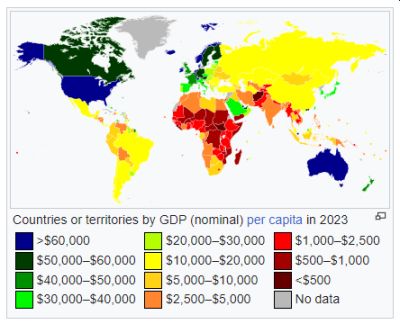 Fig. 1, World Map for “Per Capita GDP”.
In the map, the countries are color-coded based on PCGDP values. There are eleven graded zones. The dark blue colored regions like the USA and the Scandinavian countries have the highest PCGDP, above 60,000 USD. India with its dark orange color occupies the eighth position (2,500 to 5,000 USD range). India’s neighboring countries and most of Africa are occupying eighth or worse zones.
To know the position of India relative to a few other countries the following table is excerpted from the Wikipedia article.
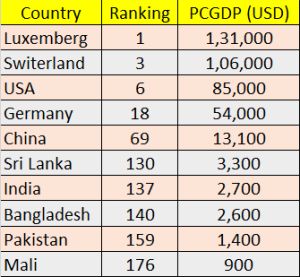 Table 1
India, Sri Lanka, and Bangladesh are close to one another, but Pakistan is much worse than India. We must note here that the Wikipedia article has listed 192 countries. So India’s rank of 137 out of 192 is certainly disheartening.
We also note from the table that China at the 69th slot with over 13,000 PCGDP is placed much above India. In this regard, I want to share with the readers a graph showing the comparative PCGDP of the two countries over the last six decades. The graph is shown below.
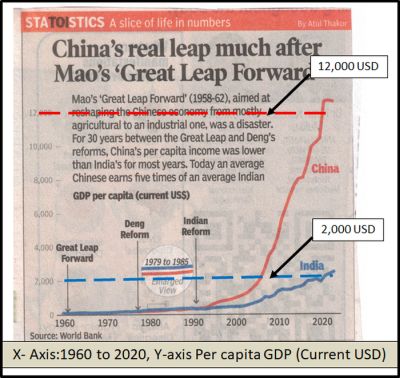 Fig. 2. PCGDP of India and China from 1960.
The two countries were on par till about 1990. Both countries have shown significant progress in the 21st century. However, China’s progress can be termed as exponential in comparison. China’s PCGDP is more than five times that of India. Another observation is that India’s progress has been almost linear during the last twenty-four years. This period comprises four years of Vajpayee rule, ten years of Manmohan Singh rule, and ten years of Narendra Modi rule. The credit for this growth, however, has got to go to the PV Narasimha Rao government which introduced many sweeping economic reforms.